

Climate
As a responsible global company, with a vision for a safe and sustainable future, LDC is committed to supporting the transition to a low carbon economy, in line with Paris Agreement goals to limit global temperature increases to 1.5°C, compared to pre-industrial levels, as defined by the Science Based Targets initiative (SBTi). To this end, we are taking action to reduce greenhouse gas emissions from LDC’s own operations, as well as those generated by activities in our value chains, and to reduce energy and electricity consumption.

Cross-Sector Action
In 2021, LDC signed the Agricultural Commodities Companies Corporate Statement of Purpose, committing to deliver a clear climate action plan alongside other agri-commodities companies.
The resulting Agriculture Sector Roadmap to 1.5°C, announced at COP 27 in November 2022, outlines plans for accelerated action to halt commodity-linked deforestation in soy, palm and other supply chains, in line with a 1.5°C scenario.
It also commits signatories to publicly disclose emissions from land-use change and set science-based targets to reduce these, no later than July 2024.
Decarbonization in Focus
LDC created its Carbon Solutions Platform in 2021 to drive company-wide decarbonization strategy across all emissions Scopes.
In 2022, the team advanced the groundwork for setting the science-based, near-term reduction target for Scope 1 and 2 emissions by 2030, announced in 2023, while advancing initiatives across its two main areas of responsibility:
- to build a portfolio of high-quality carbon avoidance and removal credits and participate in compliance and voluntary carbon markets; and
- to develop and implement LDC’s decarbonization roadmap in collaboration with all platforms and functions.
Carbon Avoidance & Removals Portfolio
In 2022, the Carbon Solutions Platform enlarged its portfolio of carbon avoidance and removal credits certified by the leading carbon standards (Verified Carbon Standard, Gold Standard and Climate Action Reserve),
with a strong focus on nature-based solutions and spanning various geographies, including Brazil, China, Indonesia, Kenya, Malawi, Paraguay and US.
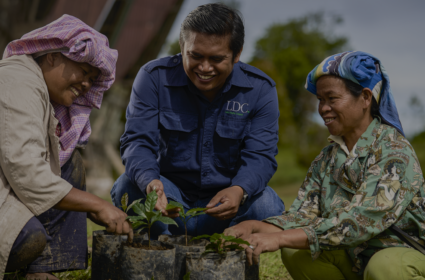
Improved Cropland Management, China
As part of this project, LDC signed a long-term removals offtake agreement with Shanghai Agro-Services that involves the introduction of a suite of regenerative agricultural practices on 20,000 hectares of degraded cropland in Hebei Province.
Practices include reduced tillage, optimized chemical fertilizer application and returning straw residue to wheat and corn fields. The project is estimated to sequester over 2.4 million tCO2e over its 20-year lifecycle.
High-Efficiency Wood-Burning Cookstoves, Malawi
LDC purchased carbon credits from this project from C-Quest Capital, which involves the distribution of locally-manufactured efficient cookstoves to 1.1. million households in rural and peri-urban areas of Malawi.
It is estimated that the project will generate 1.9 million tCO2e of emissions reductions over its 10-year lifecycle.
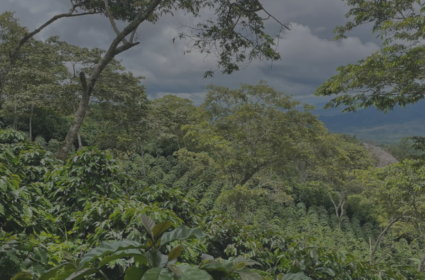
Corazón Verde del Chaco, Paraguay
LDC co-financed this project with Quadriz through the purchase of carbon credits. The project protects over 31,800 hectares of natural forest habitat that is a true biodiversity hotspot, from planned legal deforestation for agricultural purposes.
The project is estimated to generate more than 5.6 million tCO2e of emissions reductions over its first 10 years.
Participating in Carbon Markets
During 2022, LDC became an active player in the global voluntary carbon market as well as established carbon compliance schemes in Europe and US.
Our Carbon Solutions Platform opened accounts in carbon registries, became a member of several major carbon exchanges and set up trading relationships with over 10 brokerage firms and over 40 trading counterparties.
Carbon Compliance Scheme, China
LDC’s soy crushing plant in Tianjin is part of a pilot emissions trading scheme requiring to meet a 2% year-on-year greenhouse gas (GHG) emissions reduction target, starting from 2021 and based on 2019 levels.
In 2022, LDC was able to generate a small surplus of emissions allowances that were successfully sold on the market in our first emission allowance transaction in China.
Asset Improvement Initiatives
During the course of 2022, LDC invested in multiple facilities in Asia, North America and Latin America to optimize fuel and power consumption.
This was done through heat recovery and energy recycling technology, leveraging low-carbon technology to reduce emissions, for example through photovoltaic installations to generate clean energy.
Recapturing Heat & Reducing Energy Consumption, US
At our Grains & Oilseeds facility in Grand Junction, Iowa, US, we installed a dryer exhaust energy recovery (DEER) system in 2022, to recapture heat and reduce the site’s consumption of natural gas.
The moist heat previously emitted by the heat recovery steam generator stack is now recaptured and compressed back into steam energy, recycling the heat stream as a heat source in its distillation columns.
The project has reduced daily natural gas consumption by approximately 1,100 British thermal units (BTU).
Award-Winning Carbon Management, China
Our Tianjin plant received the 2022 Carbon Asset Management Pioneer Award from Tianjin Climate Exchange, in recognition of its excellent GHG emissions reduction results.
The award was granted after publication of the plant’s GHG emissions figures, which revealed a reduction of 6,809 tCO2e compared to 2021.
This progress was the result of successful electricity and steam reduction engineering projects at the plant.
Eco-Responsible Recognition, Mexico
Our El Cofre coffee plant in Mexico completed the installation of a photovoltaic system that ensures 80% of the plant’s energy supply comes from renewable sources.
After voluntary entry into an audit process to assess the plant’s legal compliance with ecological obligations, it was officially recognized as an asset belonging to an ‘Environmentally Responsible Company’ in 2022.
Energy & Electricity Consumption in 2022
The index we use to measure electricity consumption shows the ratio of electric power consumed to process (for industrial facilities) or handle (for warehousing facilities) feedstock.
It is measured in kilowatt-hours per metric ton of feedstock (kWh/MT).
Although 56% of our sites saw improvements with regard to electricity consumption, the overall figure increased marginally (0.17%) year on year in 2022, due mainly to throughput issues at certain facilities.
Nevertheless, we are pleased to report an overall reduction of 5.4% for 2022 in comparison with our 2018 baseline, in line with our reduction target of 5% for this period.

Energy Consumption Within the Organization
| Energy Source | 2022 Consumption (in GJ) |
|---|---|
| Non-Renewable | 16,254,764 |
| Renewable | 10,444,343 |
| Electricity from Grid | 3,637,435 |
| Steam Bought | 1,988,486 |
| Total | 32,325,029 |
Repartition of Non-Renewable Energy Consumed
| Energy Source | 2022 Consumption (in GJ) |
|---|---|
| Natural gas | 13,907,251 (86%) |
| Coal (sub-bituminous, anthracite, bituminous & others) | 1,339,517 (8%) |
| Biodiesels, diesel & diesel oil | 791,775 (5%) |
| Others | 216,221 (1%) |
| Total | 16,254,764 (100%) |
Total Energy Consumption Intensity
| 2022 Intensity (in GJ/ton) | |
|---|---|
| Energy intensity | 0.54 |
Five-Year Wind Power Agreement, Argentina
In July 2022, LDC signed a five-year power purchase agreement with Pampa Energia for the provision of 39’500 megawatt hours (MWh) of renewable electricity, generated by wind farm, to our Timbúes agro-industrial complex in Santa Fe, Argentina.
In addition to the electricity supply, LDC will receive the International Renewable Energy Certificates necessary to report reductions in Scope 2 emissions.
Green Power, Colombia & China
In Colombia, all electricity used to power our coffee milling plant in Pereira in 2022 is now certified as originating from renewable energy sources, which has reduced the plant’s Scope 2 emissions to zero.
In December 2022, LDC reached agreement with electricity supplier CGN for the provision of renewable electricity to cover LDC’s full 2023 electricity needs for our crushing plant in Dongguan, China, which will purchase over 29’000 MWh of renewable electricity from CGN Shanwei Jiazii 500MW offshore wind farm, operational since December 2022.